
What Are GA4 Explorations?
Google describes Explorations as a collection of advanced techniques that go beyond standard reports. You open them by clicking Explore in the left navigation of GA4[1]. Standard reports answer fixed questions (how many users, which pages). Explorations let you build your own question: which landing pages bring users who fill the form, where people leave the checkout or what visitors do after the fees page.
If you are new to GA4, start with our guide to GA4 reports for beginners, then come back here. Explorations make most sense once you know the standard reports.
How the Exploration Editor Works
| Part of the screen | What it does |
|---|---|
| Variables (left) | The dimensions, metrics and segments you import, plus the date range |
| Tab Settings (middle) | Choose the technique and drag variables into rows, values, breakdowns and filters |
| Canvas (right) | Shows the result; one exploration can hold up to 10 tabs |
You can import up to 20 dimensions and 20 metrics into one exploration. Double-click a dimension to drop it in a default place, or drag it into Tab Settings[1].
The techniques available are free form, cohort exploration, funnel exploration, segment overlap, user exploration, path exploration and user lifetime[1]. Beginners only need the first, the funnel and the path to answer most business questions.
Change This Setting First: Data Retention
By default, GA4 properties retain 2 months of data. To change it, go to Admin, then under Data collection and modification click Data Retention[1]. Explorations work on the event data GA4 still holds, so a property left at 2 months cannot explore last Diwali's campaign. Standard reports are not limited the same way, which confuses many beginners.
Free Form Exploration: Your Own Table
- 1Open Explore and click Blank or Free form
The default technique for a new blank exploration is the free form table.
- 2Import variables
Click + next to Dimensions and import Landing page and Session source / medium. Click + next to Metrics and import Sessions and Key events.
- 3Build the table
Drag Landing page into Rows, Session source / medium into Columns and the two metrics into Values.
- 4Filter and read
Add a filter for the pages you care about. Change the visualisation to a bar or line chart if it helps.
Key events need to be set up first; our guide on how to set up key events in GA4 shows how.
Funnel Exploration: Where Do Users Drop Off?
A funnel exploration shows the steps users take to complete a task and how many succeed or drop out at each step. You create one in Explore under Start a new exploration, using the Funnel exploration template[2].
- Open or closed funnel: in an open funnel users can enter at any step; in a closed funnel they must start at step one and are counted only in the order you set[2].
- Standard or trended: a stepped bar chart, or a line chart that shows each step over time[2].
- Save as a report: you can save a funnel exploration as a funnel report for quicker access later[2].
Path Exploration: What Do Users Do Next?
Path exploration shows user journeys as a tree. Choose a starting point (for example the page title of your home page) or an ending point, then click any node to see the next step. By default each step shows the top 5 pages or events[3]. It is the quickest way to answer questions such as which page new users open after the home page, or whether people loop between two pages because they are stuck.
Why Explorations Matter in a Marketing Job
Clients rarely ask how many visitors came. They ask why enquiries dropped, which campaign brings buyers and where the form loses people. Explorations are how a marketer answers with evidence. In interviews for analytics or performance roles, being able to build a funnel on the spot sets you apart from candidates who only read the home dashboard. It also connects your ad work to results; see Google Ads conversion tracking for the other half of that picture.
Portfolio Projects You Can Build
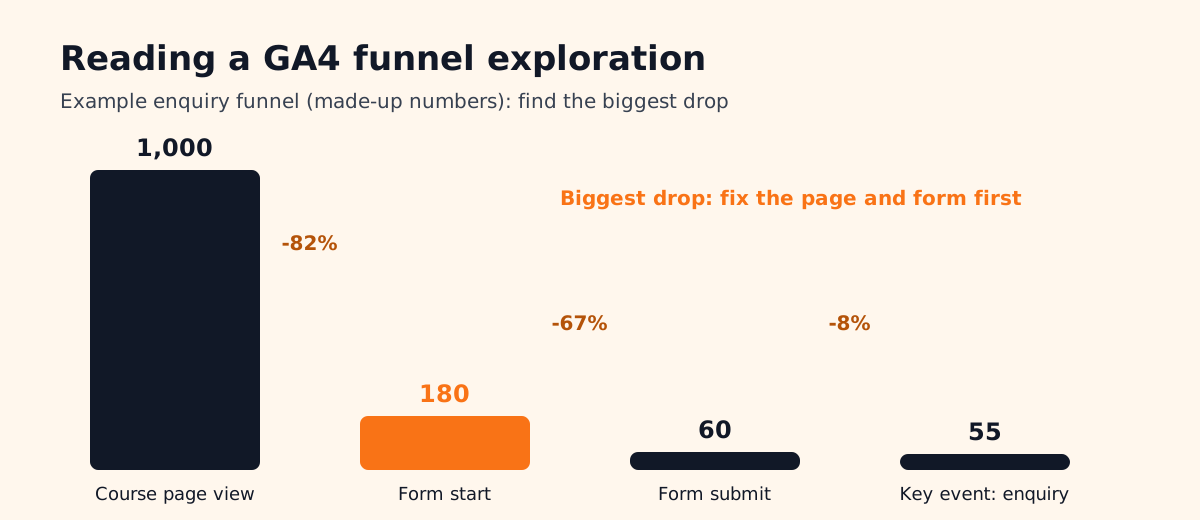
- Enquiry form funnel: course page view, form start, form submit, key event. Find the step with the biggest drop and suggest one fix.
- Landing page quality table: a free form table of landing pages by source with sessions and key events. Rank pages by key events per session.
- After the fees page: a path exploration starting at the fees or pricing page. Where do visitors go next and where do they leave?
Worked example. Say a coaching centre's site gets 1,000 users on its course page in a month. The funnel shows 180 start the form and 60 submit it. The biggest drop is between page and form start, so the first fix is above the form (a clearer offer and a shorter form), not the ads. Write this up on one slide with the funnel screenshot, the fix and what you will measure next month. That single slide is a better portfolio piece than ten screenshots of reports. If you run marketing for your own shop, this is also the check our guide to a digital marketing course for business owners recommends before spending more on ads.
Using AI With GA4 Explorations
Google's Analytics Advisor, an agent built on Gemini models, began rolling out to English-language accounts in December 2025 and answers questions about your data in plain language[4]. Marketers also export exploration data to Google Sheets and ask ChatGPT or Gemini to summarise trends.
The human check matters: confirm the date range, make sure key events are set up correctly and look for sampling before you trust any AI summary. An AI answer built on a 2-month retention window or a broken form event will be confidently wrong. CABA's courses now teach AI and agentic AI workflows inside the curriculum, with the marketer checking every number.
Why 1-to-1 Training Helps With GA4
GA4 is easier to learn on a real property with real traffic than on demo data. In one-to-one training a trainer sits with you on a live account, so you see why a funnel shows zero (usually a missing event) and fix it on the spot. Our digital marketing course covers GA4, Google Ads, Meta Ads, SEO and AI tools through live campaigns. It comes with a 100% Job Guarantee; read the job guarantee terms. See the plan for our digital marketing course in Delhi.
Frequently Asked Questions
What is the difference between GA4 reports and explorations?
Reports answer fixed questions with a standard layout. Explorations, in the Explore menu, let you build your own tables, funnels and paths with filters and segments to answer specific questions.
How do I create a funnel exploration in GA4?
Go to Explore, choose the Funnel exploration template under Start a new exploration and add your steps, such as page view, form start and form submit.
Why does my GA4 exploration show no older data?
GA4 keeps 2 months of data by default. Raise it under Admin, Data collection and modification, Data Retention. The change does not bring back data already removed.
Can I share a GA4 exploration?
Yes, if you have at least the Analyst role. People with the Viewer role can view it but must duplicate it to edit.
Is the GA4 path exploration useful for beginners?
Yes. It shows what users do after a chosen page or event and helps you spot loops where users get stuck.
References
- Get started with Explorations- Google Analytics Help
- [GA4] Funnel exploration- Google Analytics Help
- [GA4] Path exploration- Google Analytics Help
- Google's AI advisors: agentic tools to drive impact and insights (12 November 2025)- Google Blog